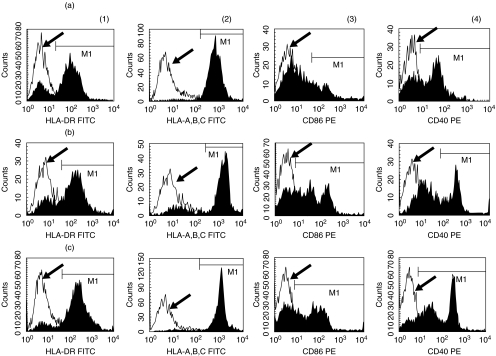
Fig. 1.
The expression of MHC class II (HLA DR) (a), MHC class I (HLA A, B, C) (b), CD86 (c) and CD40 (d) on circulating dendritic cells. The flow cytometric profiles of a representative patient with CHC before therapy (a) and 4 weeks after therapy (C) are shown. The profile in (C) shows the flow cytometric data of a representative normal control. The open histogram indicates the flow cytometric profile of isotype-matched control (arrow). The closed histogram shows the staining with respective antibodies.

