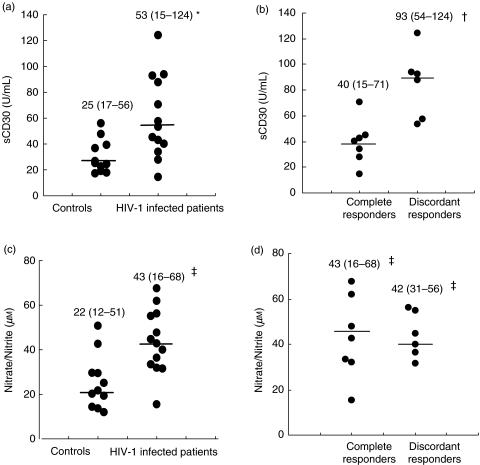
Fig. 1.
Serum sCD30 (a, b) and NO2–/NO3– (c, d) levels in controls and HIV-1 infected patients. Results are presented as median (range) and P-values are determined by Wilcoxon Rank Sum Test. Median values are shown as horizontal bars. *All HIV-1 infected patients significantly higher than controls (P = 0·007), †Discordant responders significantly higher than complete responders and controls (P = 0·004 and P = 0·0003, respectively), ‡All HIV-1 infected patients, complete responders and discordant responders significantly higher than controls (P = 0·003, P = 0·03 and P = 0·007, respectively).

