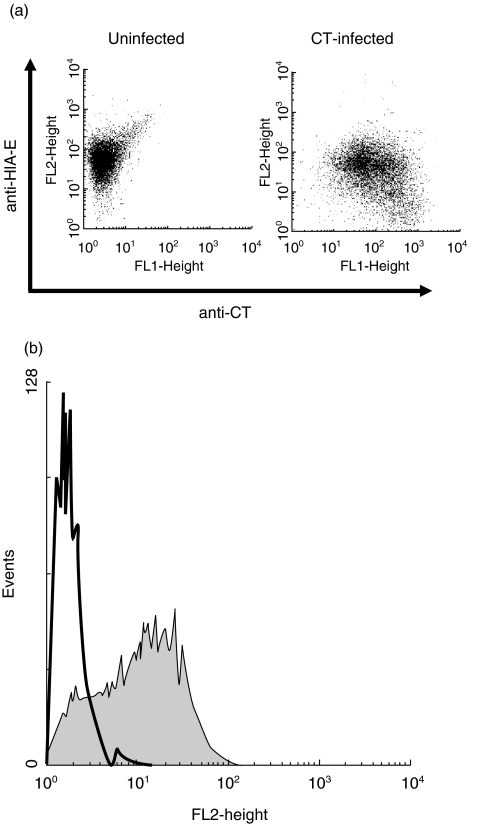
Fig. 6.
(a) CT infection decreases HLA-E and/or HLA-C expression by epithelial cells. Two-colour analysis of expression of HLA-E (y-axis), as detected by MoAb DT9 and of intracellular CT antigens (x-axis) by mock-infected SiHa cells or SiHa infected with live CT. (b) MICA/B is expressed constitutively by epithelial cells. Expression of MICA/B by SiHa cells (filled histogram). Staining using an isotype control MoAb is also shown (black line).

