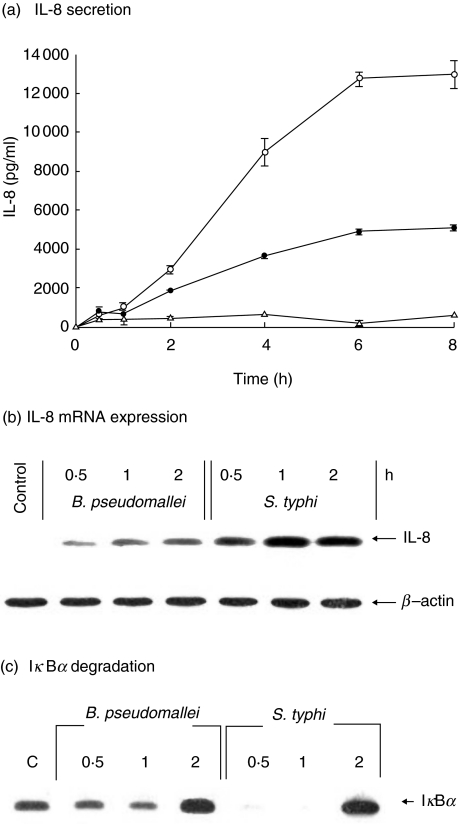
Fig. 2.
Kinetics of IL-8 production, IL-8 mRNA expression and IκBα degradation. The cells (5 × 10⁵ cells/well) were infected with either B. pseudomallei (•) or S. typhi (○) at an MOI of 10 : 1. Uninfected cells were used as control (▵). At times indicated, the supernatants were collected and analysed for IL-8 by ELISA (a). The cells were then lysed and used for analysis of IL-8 mRNA expression by RT-PCR (b) or for IκB degradation by immunoblotting (c). Data represent mean and standard errors of three separate experiments, each carried out in duplicate.

