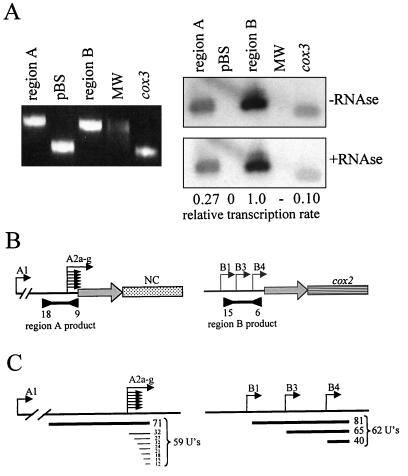
Figure 3.
Run-on transcription measurements of cox2 promoter activity. (A Left) An ethidium bromide-stained 1% agarose gel of PCR fragments representing region A promoters (pN2 and primers 9 + 18), (A Right) pBluescript KS(+) (pBS; primers T3 and T7), region B promoters (pN4 and primers 15 + 6), and cox3 (primers BR20 + GA355; ref. 19). (A Right) 32P-labeled transcripts from isolated mitochondria were hybridized with a filter blot of a similar gel and treated as described in Materials and Methods. The relative transcription rates were calculated by using a PhosphorImager. MW, molecular weight markers. (B) Maps of the master chromosome configurations in regions A and B, showing locations of the products amplified by PCR. The region A product is 287 bp and the region B product is 277 bp. Note that the stained and probed blots in A are different, and thus the migration is not identical. (C) Uridine content of initiated transcripts within each PCR product. The thickness of each line represents relative promoter strength as discussed in Results. To the right of each hybridizing segment, the number of uridines is indicated. The number outside of the brackets (59 or 62) indicates the average number of uridines in region A or B hybridizing transcripts, as discussed in Results.

