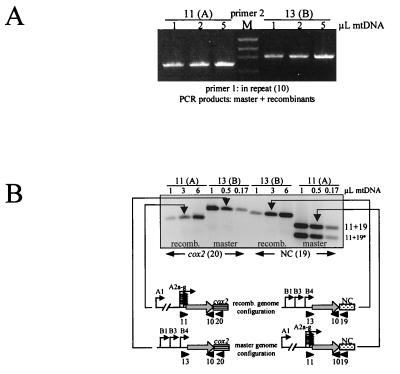
Figure 4.
Control reactions for RT-PCR analysis, with mtDNA at a concentration of 1.25 ng/μl. (A) Experiment showing that both primer pairs amplify mtDNA with approximately equal efficiency. Both reactions contained primer 10, and the second primer and its upstream promoter set are shown above each set of three lanes. The amount of mtDNA in each reaction is given in microliters. M represents molecular weight markers (ØX174 digested with HaeIII). (B) Experiment showing that primer pairs amplify the correct genome configurations in the expected stoichiometry. The primer pairs are indicated diagrammatically at the bottom, as well as above and below each set of lanes. An additional band for primer pair 19 + 11 of unknown origin is marked with an asterisk; the upper band is the expected one based on its size. The unknown band appears at different Mg2+ concentrations and annealing temperatures (data not shown). The amount of mtDNA in each reaction is indicated in microliters.

