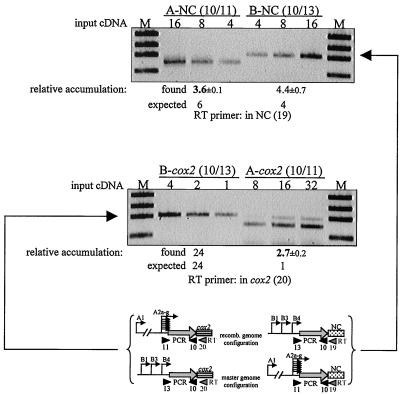
Figure 5.
Quantitative RT-PCR analysis of cox2 transcripts was performed as discussed in Materials and Methods. The amount of input cDNA is given in microliters and was adjusted to give PCR products in similar quantities. The expected values for RNA accumulation, calculated as discussed in Results and the found values, as averaged from this and 14 other experiments, are shown below each panel. The boldface values are those that differ significantly from what was expected. At the bottom of the figure, the various RT-PCR primer sets are shown diagrammatically.

