Fig. 1.
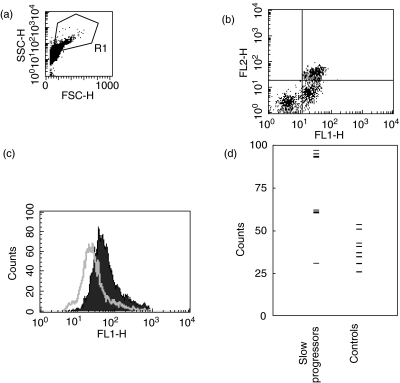
CD91 levels are increased on monocytes of melanoma slow progressors. Cells in the live gate (a) were analysed for CD91 (FL1 x-axis) and CD14 staining (b, FL2 y axis). The CD14+ cells were gated and the CD91 median fluorescence intensity on these was plotted on a histogram (c). CD91 fluorescence intensity is shown for a representative slow progressor (solid area) and control (open area). Fluorescence intensity for each patient is plotted in (d); the median CD91 fluorescence intensity was significantly higher in slow progressors than controls (see text). Isotype control staining was less than 2·5%.

