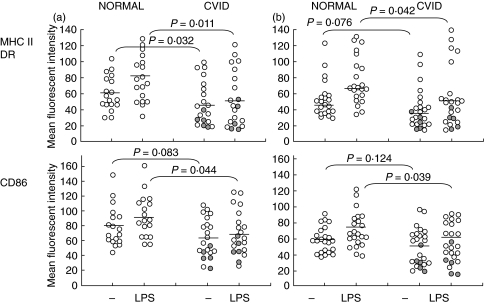
Fig. 2.
Distribution and change in MHC and CD86 with LPS stimulation in dendritic cells. (a) Individual mean fluorescent intensity from normal donors and CVID patients; MdDC-adh of normal (n = 18) and CVID (n = 21). (b) MdDC-col of normal (n = 22) and CVID (n = 24). repeat samples from low DR MdDC-adh individuals. Bars indicate median values. P-values from Mann–Whitney U-test.

