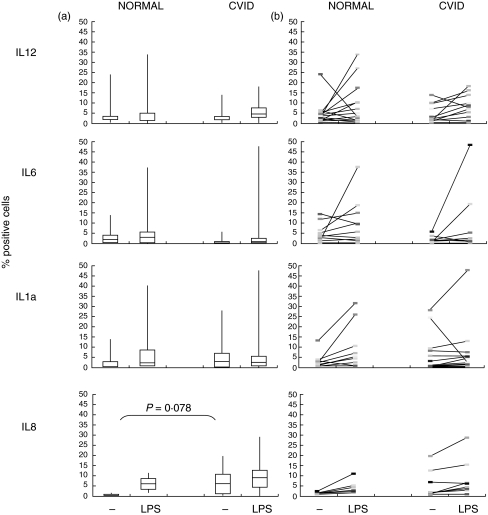
Fig. 3.
Change in cytokine and chemokine expression with LPS stimulation in normal and CVID MdDC-adh cells. (a) bar shows median, 25–75% in boxes and complete ranges (|) in percent positive expression on DCs from normal donors and CVID patients. (b) individual changes in IL-12, IL-6, IL-1a (18 controls and 21 patients) and IL-8 expression (8 controls and patients) with LPS stimulation. P values from Mann–Whitney U-test.

