An official website of the United States government
Here's how you know
Official websites use .gov
A
.gov website belongs to an official
government organization in the United States.
Secure .gov websites use HTTPS
A lock (
) or https:// means you've safely
connected to the .gov website. Share sensitive
information only on official, secure websites.

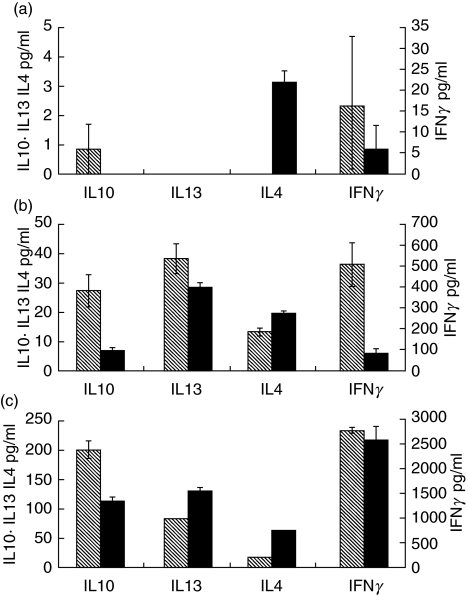
 ) and Patient (▪) T cells stimulated with (a) anti-CD3 alone, (b) anti-CD3 and anti-CD28 or (c) anti-CD3 and dendritic cells. Error bars show SEM of triplicated experiments. Note differences in scales.