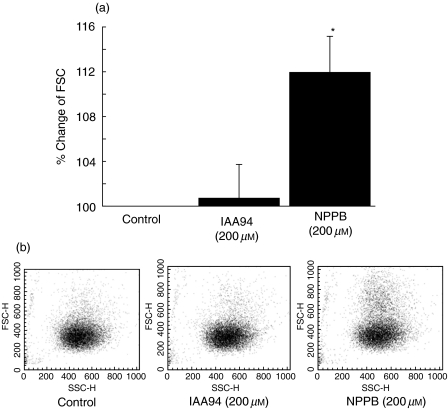
Fig. 3.
Effect of Cl– channel blockers on monocyte shape change. The resulting shape change of the monocyte was measured simultaneously, as described in the text. Results are expressed as percentage increase in FSC induced by each Cl– channel blocker compared with that of unstimulated cells (a). (b) Representative dot-plot of FSC versus SSC of 10 000 monocytes. The data are shown as the mean ± s.e.m. (n = 4–6).

