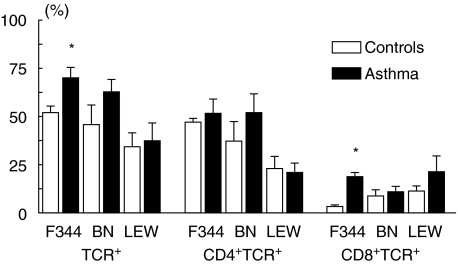
Fig. 1.
T cell receptor positive (TCR+), CD4+TCR+ and CD8+TCR+ cells in the BAL of Fischer 344 (F), Brown Norway (BN) and Lewis (LEW) rats after sensitization and challenge with OVA (asthma group; black bars) or application of saline according to the same protocol (control group; open bars). All data derived from FACS analysis and represent relative cell counts in percentage of lymphocytes. Data represent mean ± s.e.m. of three to five rats per group. *P < 0·05.

