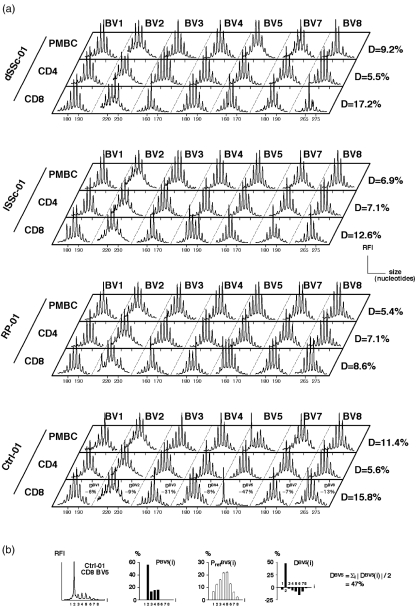
Fig. 1.
Qualitative T cell repertoire analysis and method for quantifying the extent of T cell repertoire perturbations. (a) Examples of immunoscope profiles of unsorted PBMC, and CD4 and CD8 T cells from dSSC, lSSc, RP patients and Ctrl. Only the first 7 BV (out of the 14 BV families analysed) are displayed. RFI, relative fluorescence intensity. (b) To quantify repertoire perturbations, the CDR3 profiles for each BV family is translated into a probability distribution PBV(i) for each peak i (i = 1–8). The extent of perturbation DBV(i) for each peak i is computed by the distance between PBV(i) values from the sample and PrefBV(i) values from a reference distribution (mean ± SEM). The perturbation DBV is then calculated as Σi |DBV(i)|/2. The mean of DBV perturbations for all 14 BV families yields the average perturbation D = Σk DBVk/14. An example of calculation is given for BV5 in CD8 T cells from Ctrl-01. All DBV results for this sample are displayed in (a). Average D-values (computed on 14 BV families) are also given in (a) for all displayed samples.

