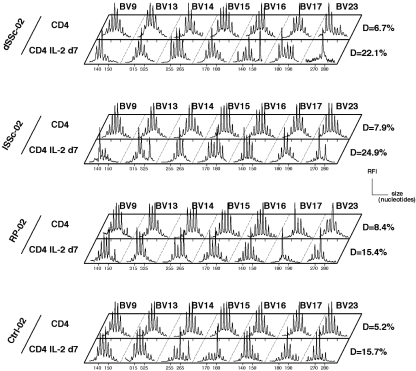
Fig. 3.
Repertoire analysis of CD4 T cells after culture with IL-2. Example of immunoscope profiles of CD4 T cells (before culture and d7 postculture) from dSSC, lSSc, RP and Ctrl. Only the last 7 BV (out of the 14 BV families analysed) are displayed. Perturbation indices D are given for all samples.

