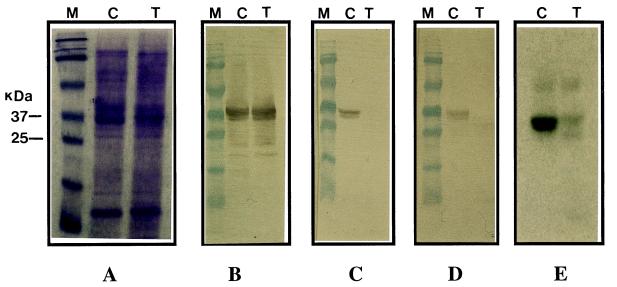
Figure 2.
Western blot analysis of ryegrass pollen proteins. The position of molecular mass markers are shown at left. In all cases, 10 μg of pollen protein was loaded per lane. (A) SDS/PAGE of total proteins stained with Coomassie brilliant blue R250. (B–E) Western blots probed with anti-Lol p 1 monoclonal antibody (B), anti-Lol p 5 monoclonal antibody (C), anti-Lol p 5 polyclonal antibodies (D), and IgE antibodies from serum of a patient allergic to grass pollen (E). M, mass marker; C, nontransformed control; T, transgenic ryegrass plant.

