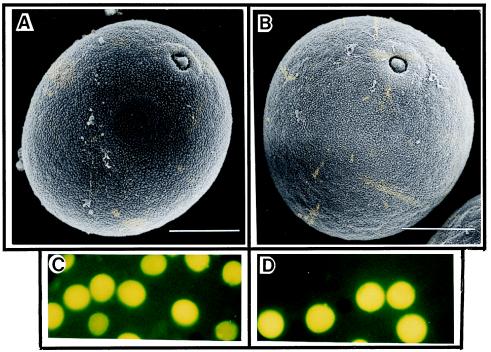
Figure 6.
Scanning electron microscopy (A and B) and pollen viability test (C and D) of control and transgenic ryegrass pollen. (A and C) Pollen from control plant. (B and D) Pollen from transgenic plant. No difference between pollen of control and transgenic ryegrass was observed. (A and B, bars = 10 μm.)

