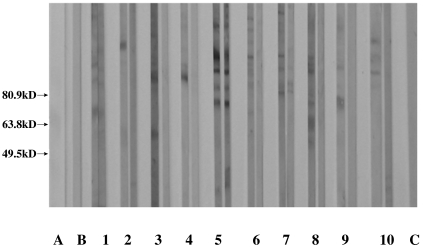
Fig. 1.
Immunoblotting analysis of AECAs’ changes of the 10 positive sera from active phase to remission phase in patients with PTU-induced ANCA positive vasculitis. Line A: molecular marker; line B: blank control (PBS); lines 1–10: sera from the 10 positive patients (as nos 1–10 in Table 1) in every pair of strips; left: sera at active phase, right: sera at remission phase. Among them, lines 2–4, 6, 8–10 turned negative at remission phase. Line C: normal control.

