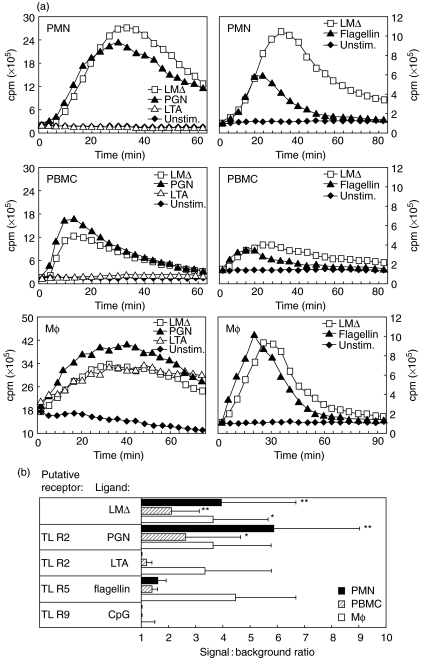
Fig. 4.
LCL in response to LMΔ, PGN, LTA, flagellin and CpG by PMN, PBMC and Mφ. (a) Mean temporal CL traces of a representative experiment are shown. (b) Average signal-to-background ratios (n = 3) for each cell type of LMΔ-stimulated versus unstimulated cells integrated over the whole experiment are shown. Asterisks denote statistically significant differences (*P < 0·05, **P < 0·01).

