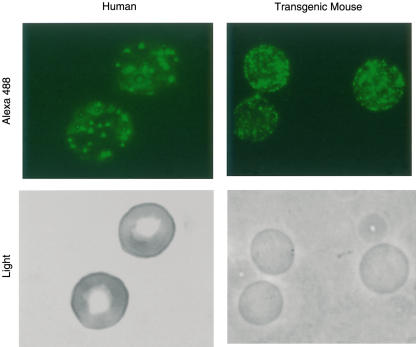
Fig. 3.
Distribution of complement receptor 1 (CR1) on mouse and human E (hE). hE (left panels) and transgenic mouse E (mE) + CR1 (right panels) were reacted with Alexa 488 labelled anti-CR1 MoAb 7G9 and viewed by light (lower panels) and fluorescent microscopy (top panels). Clustering of CR1 is seen on both cell types, although the clusters were consistently smaller and more numerous on the mE + CR1.

