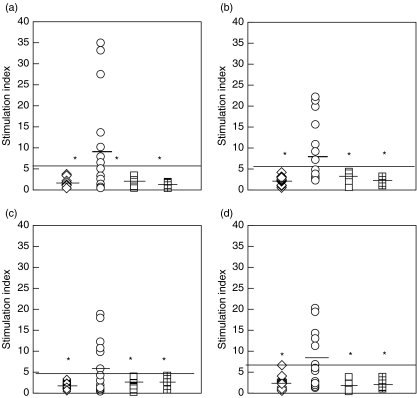
Fig. 1.
Scatter diagram showing stimulation indices (SI) of PBMCs from normal subjects (open diamonds; n = 18), BD patients (open circles; n = 18) non-BD group (open squares; n = 18) and patients with retinal damage due to photocoagulation (checked squares; n = 9) stimulated with tropomyosin. (a,b) shows responses against Bovine tropomyosin (BT) 10 µg/ml and 20 µg/ml while (c,d) indicates responses against the human tropomyosin (HT) 10 µg/ml & 20 µg/ml, respectively. Black bars indicate the mean proliferative responses of each group. Solid black line indicates the upper limit of normal proliferative responses (Mean + 3SD). *indicate significant proliferative responses in BD patients compared with normal or disease controls P-value < 0·02.

