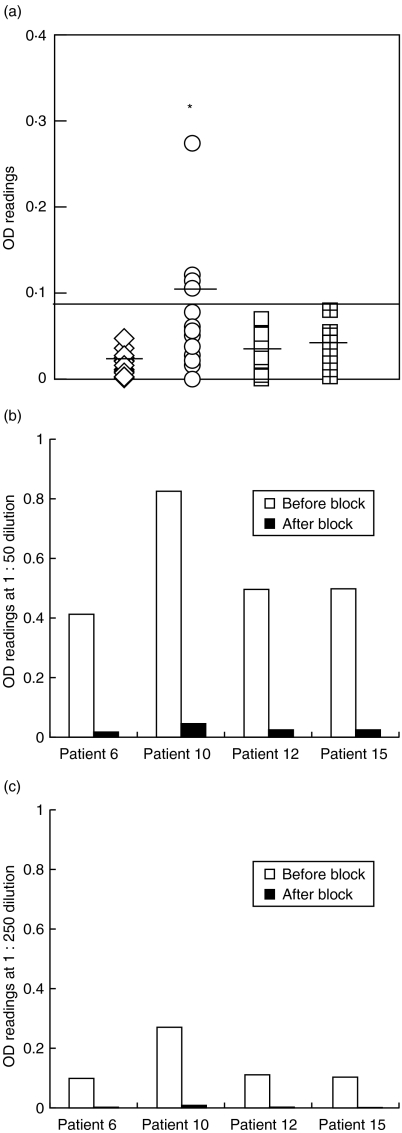
Fig. 2.
ELISA for serum anti-tropomyosin antibodies in BD patients as well as healthy and disease controls. (a) shows optical density (OD) values for serum anti-tropomyosin antibody (1 : 250 dilution) from BD patients (open circles); healthy controls (open squares); disease controls (open diamonds) and patients with retinal damage due to photocoagulation (checked squares). Black bars indicate the mean OD value for each group. OD values above the solid black line indicate positive sera (OD > mean + 3SD). *indicates significantly higher levels of anti- tropomyosin antibodies in the BD patients compared to the healthy and disease controls P < 0·002. (b,c) represents ELISA data from a blocking experiment done on four patients who were positive for anti-tropomyosin antibodies. Serum dilution (b) 1 : 50 and (c) (1 : 250). □ OD readings without blocking; ▪ OD readings after pre incubating the serum with human tropomyosin antigen at 20 µg/ml before doing the ELISA. Note the lower values for the black bars for each patient indicating the specificity of ELISA.

