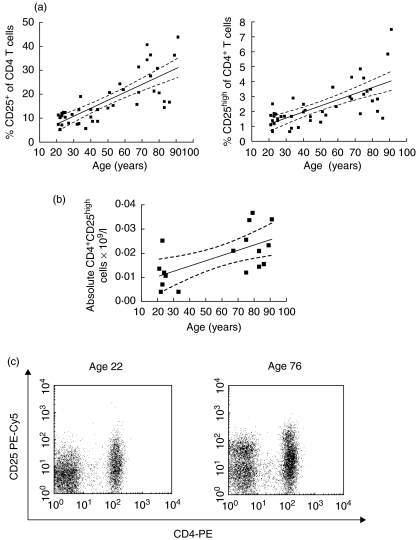
Fig. 2.
Analysis of CD4+ CD25+ and CD4+ CD25high T cells with age. The percentage of CD4+ lymphocytes which are CD25+ (a) and CD25high(b) plotted against subject age. Linear regression analysis is shown (solid line) with 95% confidence intervals (dotted lines). (c) Representative FACs plots are shown demonstrating CD4-PE and CD25-PC5 staining in a young donor aged 22 (left) and an elderly donor aged 76 (right).

