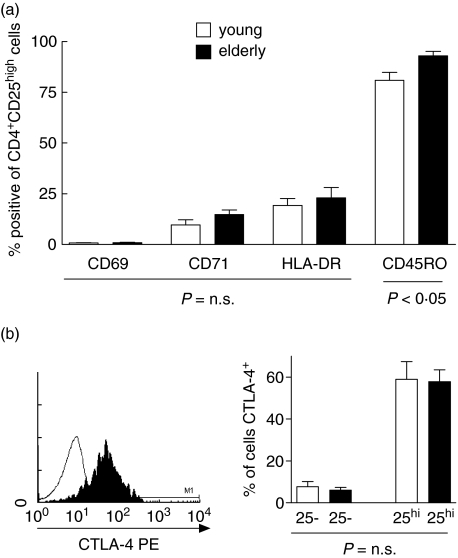
Fig. 3.
Phenotype of CD4+ CD25high T cells in young and elderly subjects. (a) The membrane phenotype of CD4+ CD25high T cells was assessed by three-colour flow cytometry in both young (n = 11) and elderly (n = 11) subjects. The percentage of CD4+ CD25high T cells expressing a panel of markers (CD69, CD71, HLA-DR and CD45 RO) are shown for both young (open bars) and elderly (filled bars) volunteers. Significant differences are indicated below the columns. (b) Cells were stained with surface CD4-fluoroscein isothiocyanate (FITC) and CD25-PC5 and then fixed and permeabilized prior to intracellular staining with CTLA-4 (shaded line) and appropriate isotype control (solid). (c) Percentage of CD4+ CD25high and CD4+ CD25neg T cells expressing intracellular CTLA-4 is shown for young (n = 5) and elderly (n = 5) subjects.

