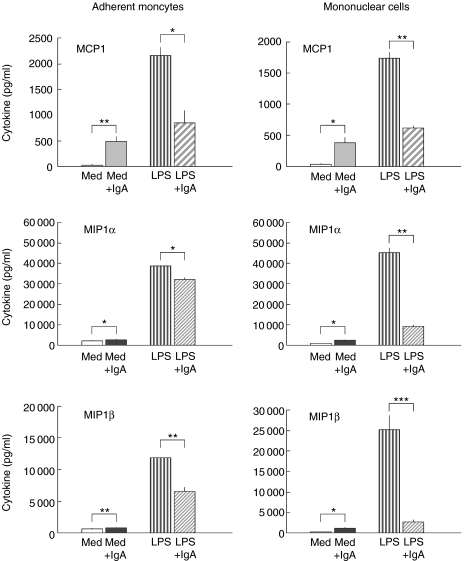
Fig. 5.
Serum IgA (10 mg/ml) induced modulation of the release of chemokines: monocyte chemoattractant protein 1 (MCP1), macrophage inflammatory protein 1 alpha (MIP1α) and beta (MIP1β). The results are arithmetic means from triplicate cultures ± SD (n = 3) stimulated for 24 h (representative results from one blood donor). Monocytes and PBMC were stimulated with LPS alone ( ), or with LPS in the presence of serum IgA: Lot 582 (
 ) or Lot 593 (
 ). To estimate the influence of IgA on resting monocytes or on resting PBMC the cells were incubated with IgA alone: Lot 582 (
 ) or Lot 593 (▪). Control cells were cultured in medium (Med) alone (□). Statistically significant difference between either IgA-treated versus control cultures or IgA + LPS-treated versus LPS alone denoted as: *P < 0·05, **P < 0·01, ***P < 0·001.

