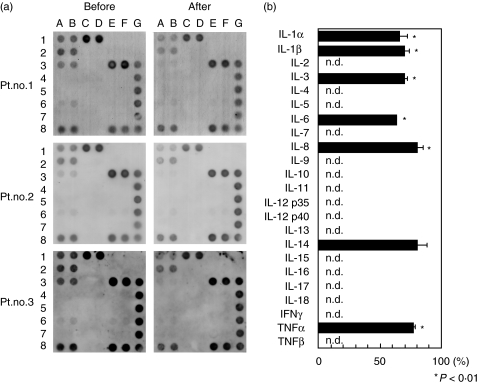
Fig. 2.
A cDNA array analysis of cytokine gene expression. PBMCs (106/ml) were obtained from patients with UC before and after first LCAP and cultured with LPS at 10 ng/ml for 24 h. Cell lysates were tested for cytokine mRNA using a GEArray, as described in Subjects and Methods. (a) Representative data for cytokine mRNA expression from three UC patients. IL-1α = 1 A, 1B; IL-1β = 1C, 1D; IL-2 = 1E, 1F; IL-3 = 2 A, 2B; IL-4 = 2C, 2D; IL-5 = 2E, 2F; IL-6 = 3 A, 3B; IL-7 = 3C, 3D; IL-8 = 3E, 3F; IL-9 = 4 A, 4B; IL-10 = 4C, 4D; IL-11 = 4E, 4F; IL-12 p35 = 5 A, 5B; IL-12 p40 = 5C, 5D; IL-13 = 5E, 5F; IL-14 = 6 A, 6B; IL-15 = 6C, 6D; IL-16 = 6E, 6F; IL-17 = 7 A, 7B, IL-18 = 7C, 7D; IFNγ = 7E, 7F; TNF-α = 8 A, 8B; TNFβ = 8C, 8D; β-actin = 3G, 4G; GAPDH = 5G, 6G, 7G, 8E, 8F, 8G; pUC18 = 1G, 2G. (b) Quantitative analysis of cytokine mRNA expression in the same patients. Densitometric analysis was performed, and values are expressed relative to corresponding housekeeping gene transcripts (β-actin). Percent changes in expression of genes in post versus pre-LCAP samples are presented. Similar data were obtained from two additional patients. n.d., not detected. PBMC, peripheral blood mononuclear cell; UC, ulcerative colitis; LCAP, leukocytapheresis; LPS, lipopolysaccharide; IL, interleukin; TNF, tumour necrosis factor; GAPDH, glyceraldehyde-3-phosphate dehydrogenase.

