
Figure 12.
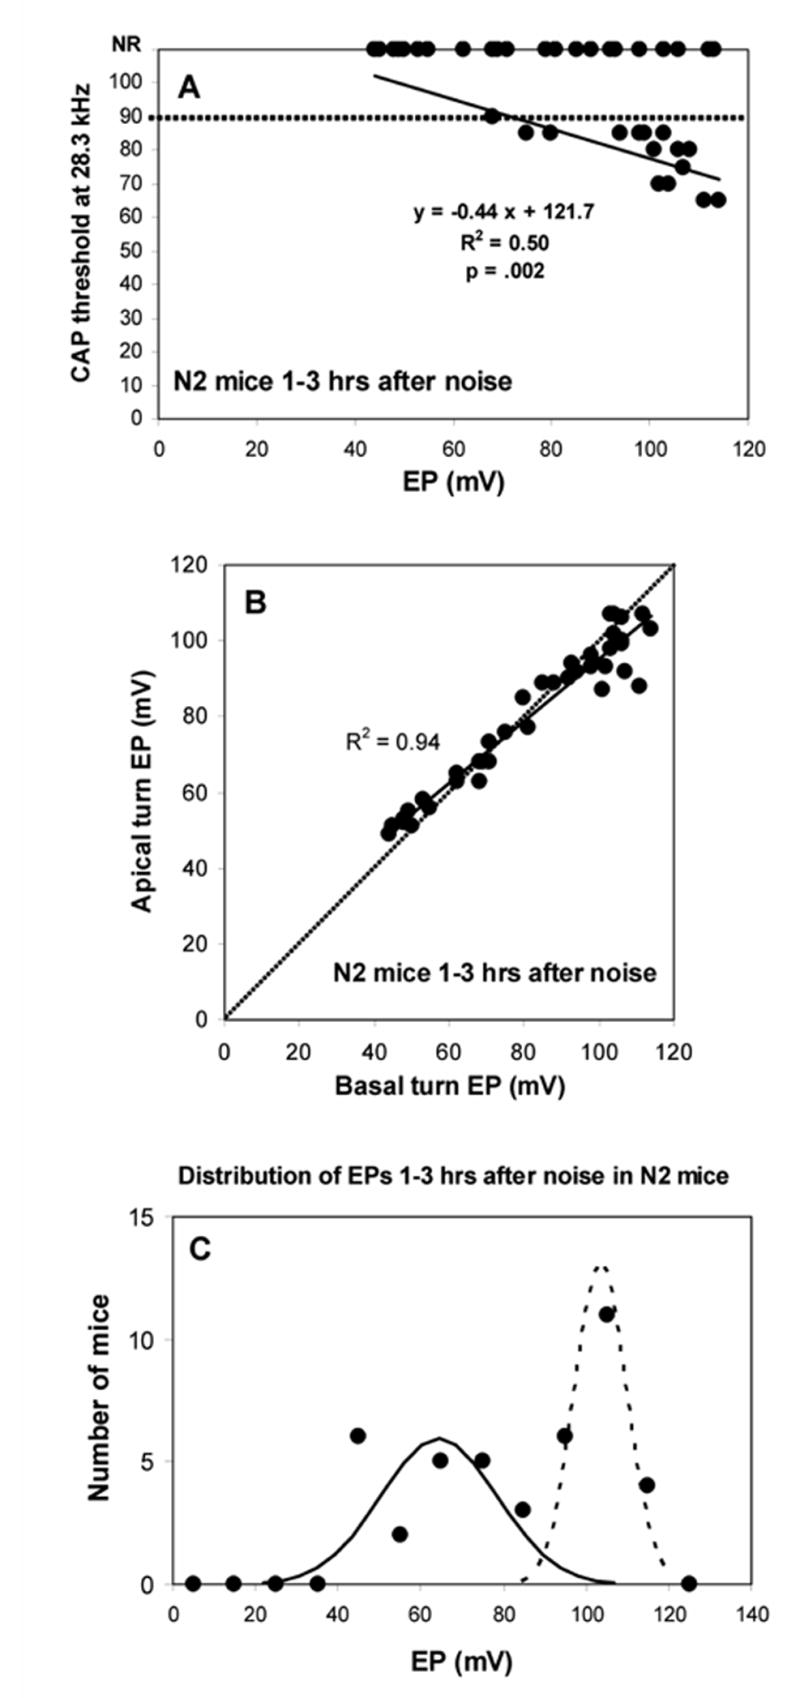
Physiological measures in N2 backcross mice measured 1–3 hrs after noise exposure. A. CAP threshold at 28.3 kHz versus basal turn EP. Roughly half the animals showed no CAP response, largely independent of EP. Among mice showing a response, there was a significant negative correlation between threshold and EP, indicating an impact of the EP on acute threshold shifts. The dotted line indicates that maximum output of the sound system at 28.3 kHz. B. Basal turn EP versus apical turn EP for the animals depicted in A. As also shown in Figure 2, the normal spatial gradient for the EP is altered when the EP is reduced by noise exposure. C. Distribution of basal turn EP values for the same animals. EPs were sorted into 10 mV bins. 21 of 42 mice showed EPs below 90 mV; 21 showed higher EPs. Distribution was not normal, but was well fit by two Gaussians with mean±SD of 64.3±14.1 mV (‘depressed EP’ cluster) and 103.5±6.3 mV (‘normal EP’ cluster).