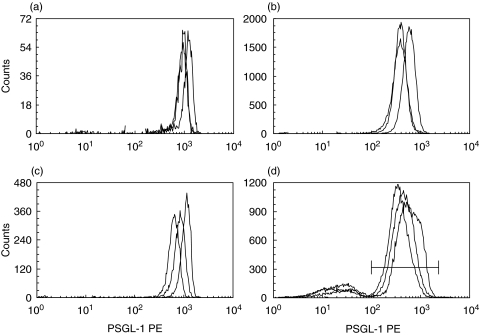
Fig. 1.
Flow cytometry of WBC. Representative histograms for PE-fluorescence (PSGL-1) for nonsmoker (grey line), smoker (thin black line) and COPD (solid black line) are shown for (a) eosinophils (b) neutrophils (c) monocytes and (d) lymphocytes. For lymphocytes only the right peak within the marker region (horizontal line) was included in the analysis.

