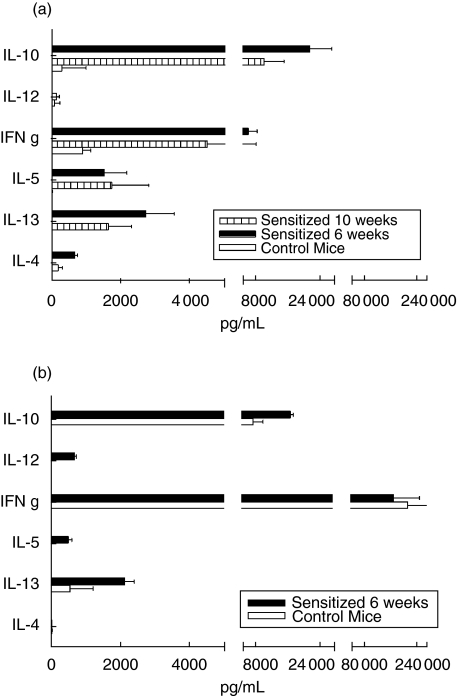
Fig. 6.
Splenocyte cytokine profile. (a) Splenocytes from sensitized and control mice (□) were stimulated by Anisakis simplex crude extract, on week 6 (▪) or 10 ( ). (b) A non specific stimulus (concanavalin A) was used to stimulate splenocytes from both groups on week 6: sensitized (▪) and control (□). Supernatant cytokine levels are expressed as ng/ml (mean of 4 mice ± SEM)

