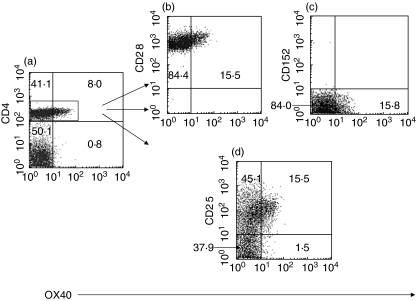
Fig. 2.
Representative examples of flow cytometry plots showing (a) CD4+OX40+ T-cells from one MG patient (15·5% of total CD4+T-cells expressed OX40) and surface expression of (b) CD28 (100%) (c) CD152 (CTLA-4) (< 1%) (d) CD25 on CD4+OX40+ T-cells. CD4+OX40+ T-cells exhibited elevated CD25 (91%) expression compared with CD4+OX40- T-cells (54·5%).

