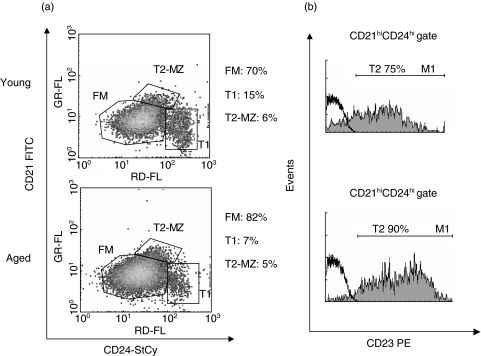
Fig. 6.
Splenic B cell subset from young and aged mice. Splenocytes from young and aged mice were stained with anti-mouse CD21, CD24, CD19 and CD23 mAbs. (a) Two-colour dot plot graphics show the percentage of T1, T2-MZ and FM B cells within CD19+ gated population. (b) Gray histogram represent CD23 surface expression within CD21high CD24high gated population. Isotype control Ab is shown as thick black line histograms. One typical experiment from the three performed is shown.

