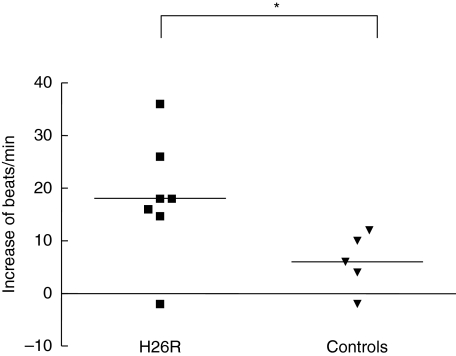
Fig. 2.
Chronotropic action of rat immunoglobulin (IgG). Chronotropic response of IgG from H26R immunized (n = 7) and control rats (n = 5) on neonatal rat cardiomyocytes. The response is shown in increase of beats/min after addition of IgG compared to basal beating frequency and the horizontal lines corresponds to the mean value of each group. Statistical analyses between the groups were made with the Mann–Whitney test, *P < 0·05.

