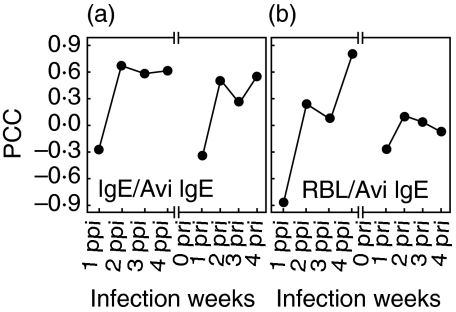
Fig. 6.
Correlation between IgE avidity and allergic state. Pearson's correlation coefficients were calculated (a) between specific IgE avidity and specific IgE, and (b) between specific IgE avidity and RBL-2H3 exocytosis. RBL indicates RBL-2H3 exocytosis. The x-axis indicates weeks after infection.

