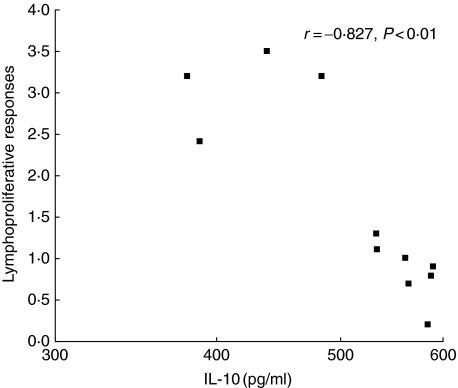
Fig. 5.
Correlation between proliferative responses and interleukin (IL)-10 levels in response to stimulation with F1–F11 antigenic fractions of Leishmaniasis donovani promastigotes of exposed group. Each data point represents the median value for the lymphoproliferative responses and the IL-10 levels to each of 11 fractions. P indicates level of significance. Correlation was determined by Spearman's rank correlation; r = regression constant for correlation.

