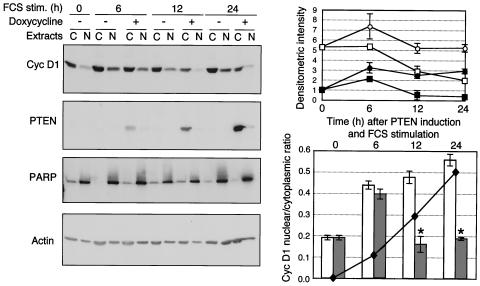
FIG. 5.
PTEN prevents the nuclear localization of cyclin (Cyc) D1. Western blot analysis of cyclin D1 subcellular distribution in PTEN-inducible U-87 cells. Equal volumes of nuclear (N) and cytoplasmic (C) extracts from cells processed as described in the legend to Fig. 2 were analyzed with the indicated antibodies. Because the protein concentrations in cytoplasmic extracts were twice as high as those in nuclear extracts after loading of the same volume of extract, the data presented here underestimate the nuclear cyclin D1 amounts by twofold. The intensity of cyclin D1 expression was measured in the cytoplasmic extracts and normalized to the cytoplasmic actin levels, and that measured in the nuclear extracts was normalized to the nuclear PARP levels. The normalized cyclin D1 levels are plotted in the upper graph (○ and □ represent cytoplasmic values for noninduced and PTEN-induced cells, respectively, and • and ▪ represent nuclear values for noninduced and PTEN-induced cells, respectively). The lower graph shows the nuclear/cytoplasmic ratio of the normalized levels of cyclin D1 for noninduced cells (empty columns) and PTEN-induced cells (filled columns). The means and standard deviations from three experiments are shown. Asterisks represent significant differences (P < 0.01) between the nuclear/cytoplasmic ratios of noninduced and PTEN-induced cells. The superimposed curve shows the normalized values of PTEN levels in PTEN-induced cells (black diamonds) during the time course. stim., stimulation.

