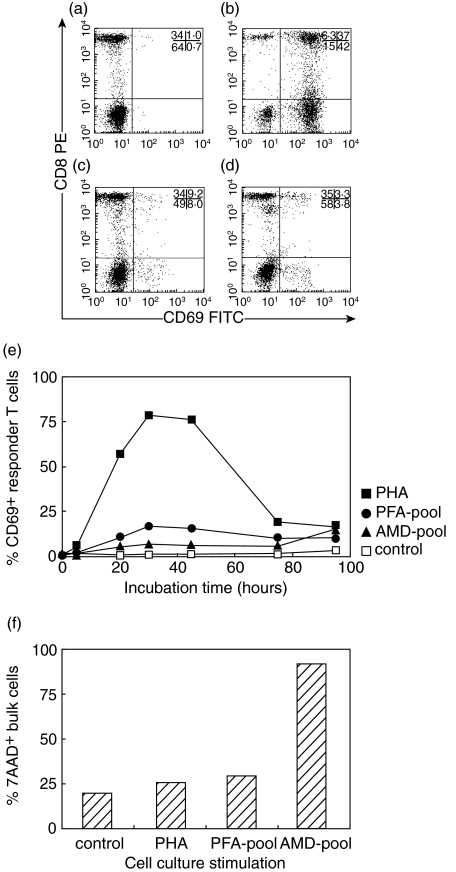
Fig. 2.
Kinetics of CD69 expression in a one-way MLR. Responder PBMC were derived from one control subject, pooled stimulator PBMC were derived from 5 different control subjects not related to the responder control. (a- d) Dot plots showing analysis of CD69 expression on gated CD3+ T-cells after 30 h of incubation in the presence of medium alone, PHA, paraformaldehyde-inactivated and actinomycin d-inactivated pooled stimulator cells, respectively. Percentages of gated events in the four quadrants are indicated. (e) CD69 expression on T-cells after incubation with medium alone (control, □), PHA (▪), paraformaldehyde-inactivated pooled stimulator cells (PFA pool, •), and actinomycin d-inactivated pooled stimulator cells (AMD pool, ▴) over a 96 h incubation period. (f) Percentage cell death (7-AAD staining) in bulk PBMC after 96 h of incubation.

