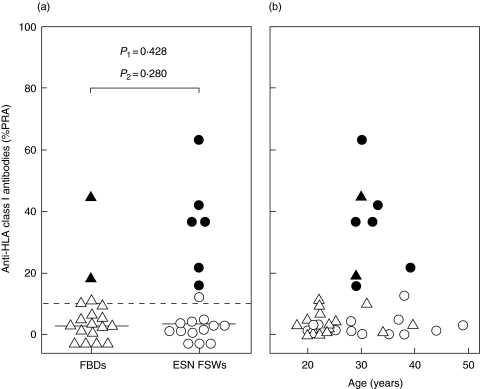
Fig. 4.
Plasma anti-HLA class I antibodies in ESN FSWs and FBDs. (a) Percentages of HLA class I panel reactive antibodies (% PRA) among ESN FSWs (○) and FBDs (▵). Filled symbols indicate percentages above 10% with a multiple-peak pattern in the histogram plot. Horizontal lines indicate median values. P1, Mann–Whitney U-test; P2, logistic regression adjusting for age. (b) Scatter plot of percentage HLA class I PRA against age among ESN FSWs (○) and FBDs (▵). Symbols as in (a).

