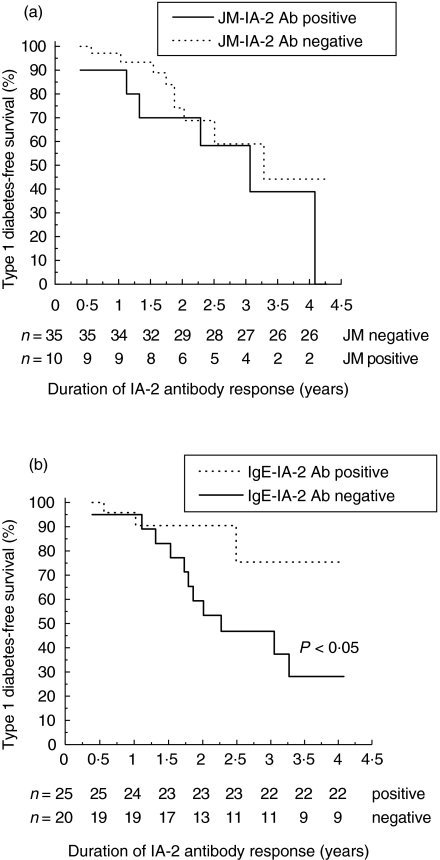
Fig. 2.
Probability of remaining nondiabetic among 45 IA-2 antibody-positive children. (a) IA-2 JM antibodies in the first IA-2 antibody-positive sample, and (b) IgE-class antibodies positive at least once versus never during the total observation period. The number of individuals remaining at each time point is indicated under the x-axis. Differences between groups were determined by Kaplan-Meier survival analysis (P < 0·05; log rank test).

