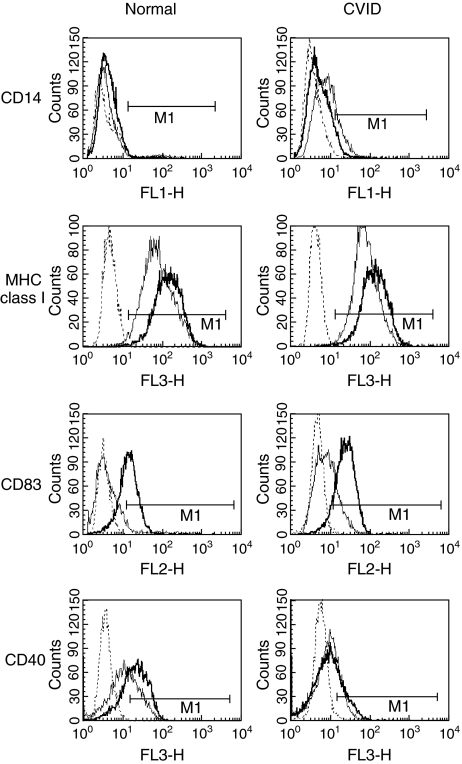
Fig 2.
Change in expression with maturation of normal and common variable immunodeficiency (CVID) dendritic cells. Expression of CD14, major histocompatibility complex (MHC) class I (ABC), CD83 and CD40 in normal and CVID individuals on day 7 without treatment (thin line) overlayed with plots of lipoloysaccharide (LPS) treated cells (thick line). Dotted histograms represent staining with isotype matched control antibody. Data representative of 18 separate experiments.

