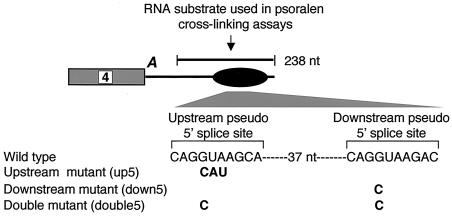
FIG. 6.
Diagram showing location of the intron enhancer (represented by a black oval) downstream of exon 4 and the two pseudo 5′ splice sites. The two splice sites are separated by 37 nt. Sequences of wild-type and mutant pseudo 5′ splice sites are shown. The black bar above the diagram indicates the RNA substrates used in all of the psoralen cross-linking assays mentioned in the legends to Fig. 7 and 8.

