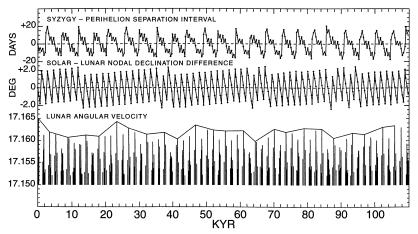
Figure 3.
Varying strength of the global tide raising forces (bottom plot), as in Figs. 1 and 2, together with parameters (top and middle plots) that reveal the basis for the 1,800- and 5,000-year tidal cycles, as described in the text. The plots are for a hypothetical 110-kyr sequence of tidal events beginning with the moon, sun, and earth in perfect alignment and closest approach (zero separation-intervals), producing a maximum γ of 17.165° per day never again attained. Tidal events occurring near peaks in the 5,000-year cycle (near zero crossings of top plot) are connected by straight lines to reveal their pattern (which includes a 23-kyr cycle not discussed in the text).

