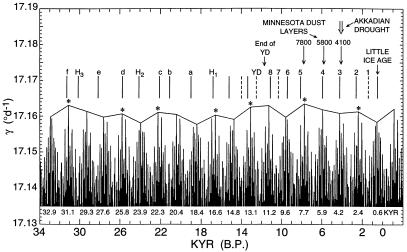
Figure 7.
Comparison of late-glacial and Holocene sedimentary core chronology of the North Atlantic Ocean basin with the times of tidal forcing. Tidal events are shown as in Figs. 1 and 2 with times of 1,800-year climactic events (in kyr BP) listed below. These climactic events are connected by line segments. Those that contribute to the 5,000-year tidal cycle are marked with asterisks. Immediately above this plot are vertical lines indicating cool periods inferred from the deep-sea core records, labeled as in Fig. 5. Their timing is derived from Fig. 5, except for Event 1 and Events 3–8, which are dates quoted in the text of ref. 2, and Event 2, inferred from Bond et al. (ref. 1, Fig. 14). Plotted as arrows are the times of dust layers in Elk Lake, Minnesota, the beginning of the Akkadian drought [as reported by Kerr (9)], the Little Ice Age, and the end of the Younger Dryas (YD) [Bond et al. (2)]. Events consistent with the hypothesis of tidal forcing of climate are shown as solid lines, exceptions as dashed lines.

