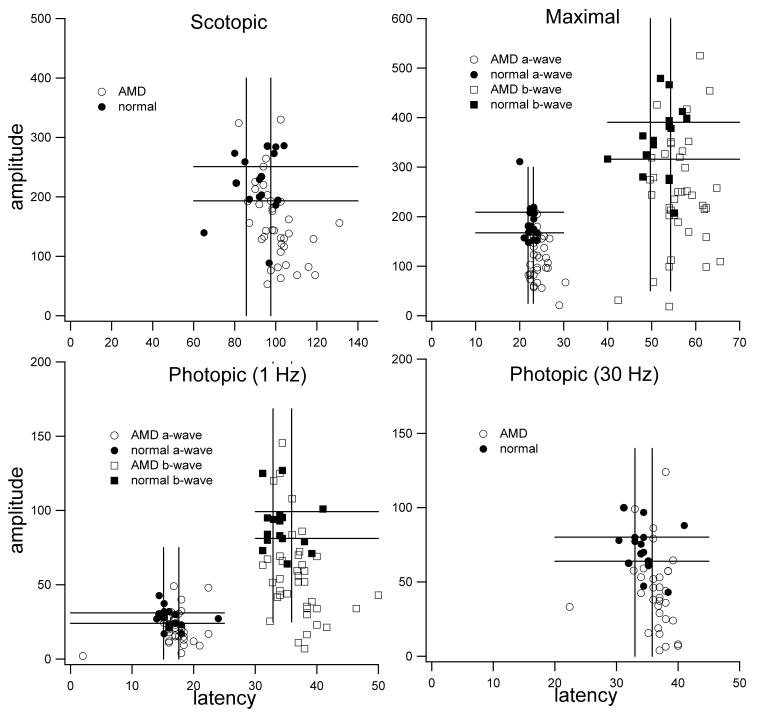
FIGURE 1.
Scatter plots of patients with age-related macular degeneration (AMD) and controls ≥70 years old; a subgroup of 36 AMD patients is compared to 16 age-matched controls without AMD. Electroretinogram amplitudes are plotted on the y-axis and latencies on the x-axis. To help reference data points, standard error lines for high and low values from mean have been drawn into graph. Scotopic responses, a-and b-wave maximal responses, a-and b-wave photopic responses, and photopic flicker are shown. The distribution of the data suggests significantly lower photopic b-wave amplitudes and a-wave maximal response amplitudes in the study group as compared to the control group.

