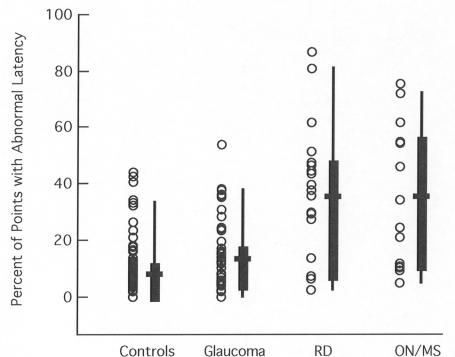
FIGURE 3.
The percent of the points with significantly (5% level) prolonged multifocal visual evoked potential (mfVEP) latencies is shown for individual eyes (symbols) of the control (n = 100 eyes), glaucoma (n = 64), retinal disease (RD) (n = 21), and ON/MS (n = 14) groups. For the patient groups, only the affected eye is included. The box plot shows the 25% to 75% range (box), the 5% to 95% range (vertical line), and the mean of the group (horizontal bar).

