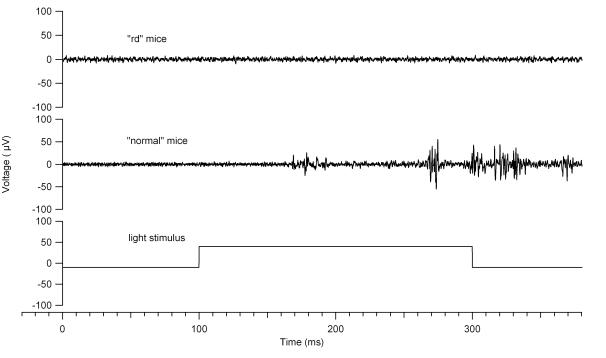
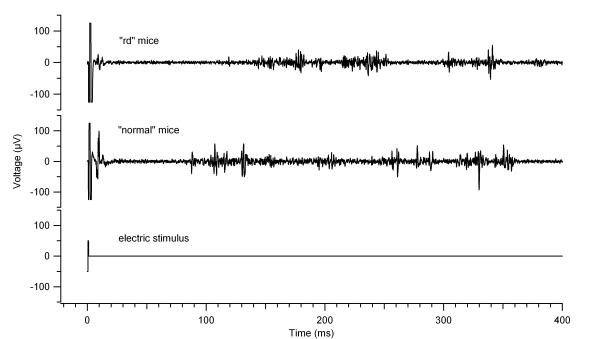
FIGURE 2.
Light and electrical response in normal and retinal degenerate (rd) mice. The traces shown were repeatable over several trials. Top, Baseline recording (0 to 100 ms) demonstrates the rate of spontaneous activity. Light stimulation begins at 100 ms and ends at 300 ms. In the light response in normal mice, note that the latency of the ON response is 80 ms. No light response was noted in the rd mice. Bottom, The electrical stimulation starts at 0 ms and lasts for 1 ms. Note that the latency of the early response is 8 ms, whereas the late response is 87 ms. In rd mice, the early and late responses begin at 4 ms and 126 ms, respectively.


