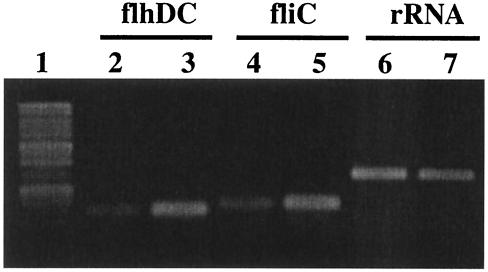
FIG. 5.
RT-PCR analysis of flhD and fliC levels in AN6 and ABR2 cells. Each reaction contained 600 ng of total RNA. A negative control reaction lacking reverse transcriptase was conducted for each primer set. Lanes: 1, base pair marker; 2, 4, and 6, RT-PCR products derived from AN6; 3, 5, and 7, RT-PCR products derived from ABR2.

