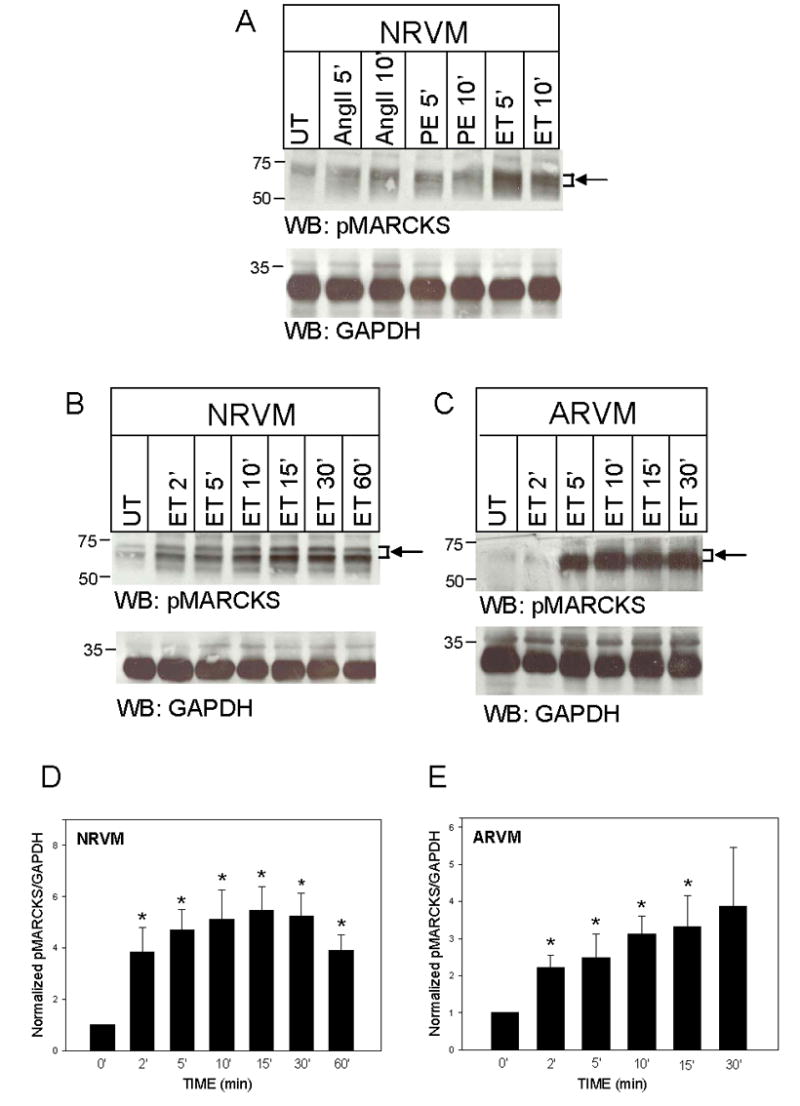
Figure 1. Hypertrophic agonists increase MARCKS phosphorylation in NRVM and ARVM.

NRVM were maintained in control medium and (A) treated with angiotensin II (AngII; 100nM), phenylephrine (PE; 50μM), or endothelin-1 (ET; 10nM) for 5–10 minutes (‘), or (B) treated with ET (10nM) for 0–60’. In panel (C), freshly isolated ARVM were treated with ET (10nM, 2–30’). Western blots (50μg of extracted protein) were probed with either an antibody specific for MARCKS phosphorylated at Serine 160/163, or an antibody that recognizes GAPDH. The positions of molecular weight standards are indicated to the left of each blot. Arrow and bracket sets indicate band area of pMARCKS used for quantitation. Panels D and E depict the quantitative analysis of 5–6 Western blotting experiments. Levels of phosphorylated MARCKS were normalized to GAPDH at each time point, and then normalized to respective levels of untreated cells (UT). Data are means ± SEM; P<0.05 vs. 0 time point.
