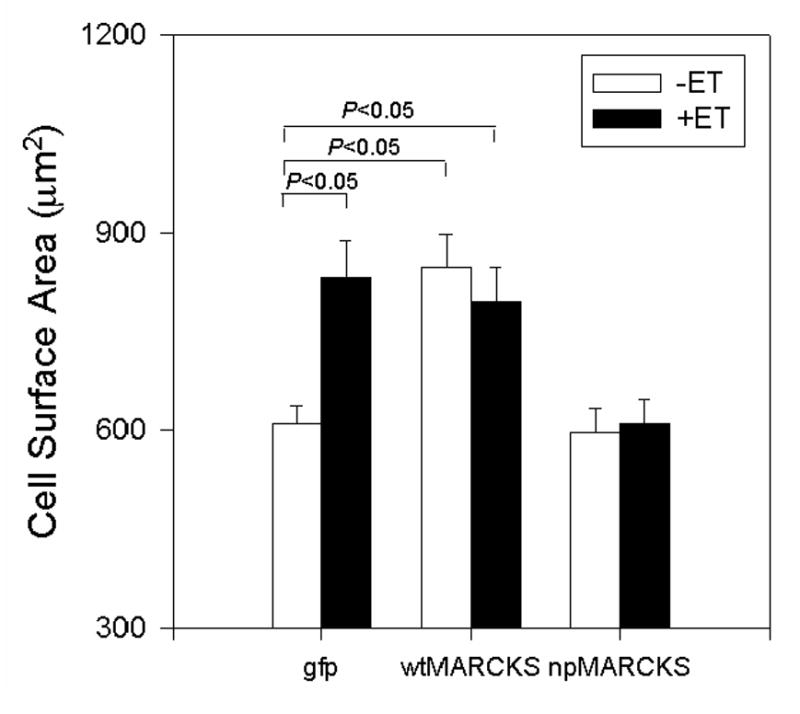
Figure 6. Effects of wtMARCKS-GFP and npMARCKS-GFP on NRVM surface area.

NRVM were infected with an adenovirus encoding either green fluorescent protein (GFP), wtMARCKS-GFP (10moi, 24h), or dnMARCKS-GFP (25moi, 48h), then treated with ET for either 16 or 24h. Cells were dye-loaded with BCECF and viewed by confocal microscopy in order to visualize the margins of the cell membrane.
