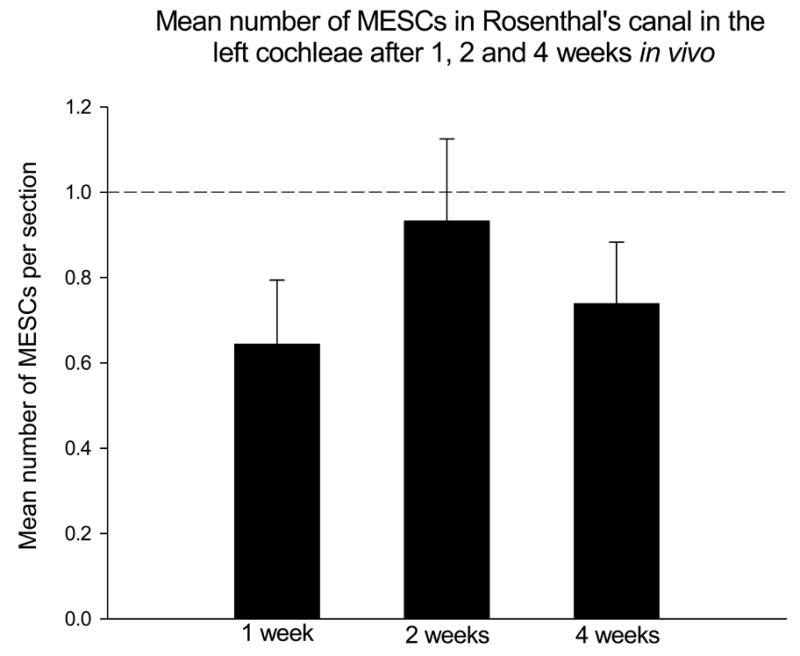
Figure 8. Mean number of MESCs within Rosenthal’s canal after 1, 2 and 4 weeks in vivo.

A two-way analysis of variance illustrated there was no significant difference detected between the mean number of MESCs within Rosenthal’s canal in the left cochleae after 1, 2 or 4 weeks in vivo. In addition, the mean number of MESCs detected within Rosenthal’s canal at any time point was never greater than 1 cell per section (perforated line). RC = Rosenthal’s canal.
