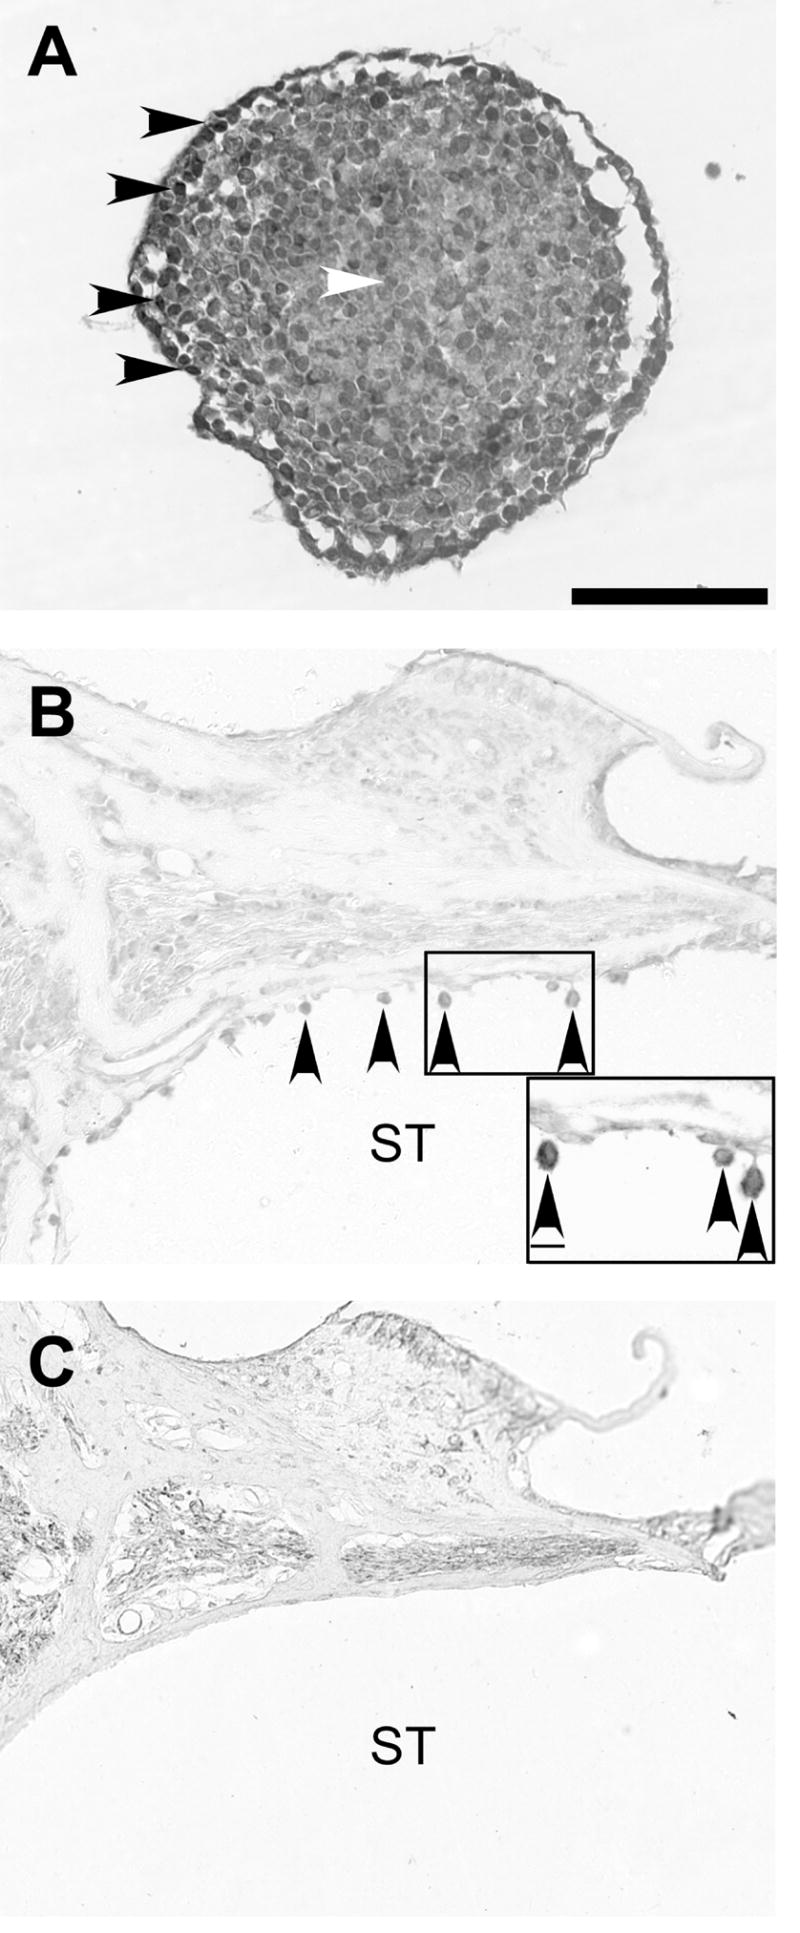
Figure 9. Neurofilament labeling of MESCs in vitro and in vivo.

Light photomicrographs illustrating neurofilament (NF-L) labelling in vitro (A) and in vivo (B, C). NF-L expression in EBs in vitro was strongest around the periphery (black arrowheads, A) and weakest in the centre (white arrowheads, A). Transverse section from the left cochlea 4 weeks following transplantation, demonstrates that a portion of MESCs retained NF-L expression in vivo (arrowheads, B). Neurofilament positive cells were not observed in the scala tympani of DMEM-treated (control) cochleae (C). ST = scala tympani. Scale bar = 100μm (for all photomicrographs). Scale bar for inset (B) = 10μm.
